Home » Covid-19 hits tourism hard in the Tri-Cities
Covid-19 hits tourism hard in the Tri-Cities

July 15, 2020
Hospitality is big business in the Tri-Cities. It just misses landing in the top five sectors, as ranked by employment levels in Benton-Franklin Trends data.
The data behind this indicator show that in 2019, hospitality employment levels averaged slightly over 10,000 in the two counties. That placed hospitality sixth. As a share of the labor force in the two counties, hospitality has consistently held that position over the past decade.
Economists put two industries into this sector: accommodations and food services. The latter is typically much larger than the former, encompassing full-service restaurants, limited-service restaurants, bars, coffee shops and food service contractors and caterers.
But hospitality doesn’t equal tourism. Whether leisure or group, tourism consists of activities spent in an area by those outside the area. It can include day-trippers and it certainly includes those who spend a night or two in local lodging facilities. Those who spend the night might be in the Tri-Cities on business, but these visitors are not considered tourists, but they fall into the category of “travel and tourism.” So, looking at the accommodations and food sector data only will overcount tourism.
Perhaps the largest factor clouding any equivalency between tourism and hospitality spending comes from food services. Over the past few decades, we’ve all developed a greater interest in dining out — in our hometowns. From data either labor or retail sales, there is no way to separate local from visitor spending.
On the other hand, a key component of tourism, shopping, isn’t a part of the hospitality definition. Nor is the (smaller) sector covering activities in the arts, entertainment and recreation. Nor is transportation, whether ground and air, part of the hospitality sector. The absence of these sectors from the hospitality sector implies an undercount of tourism.
Simply, our country’s economic data system doesn’t have a line item for tourism, at least at the state and local level. For several years, the keepers of gross domestic product, or GDP, the Bureau of Economic Analysis, or BEA, added a “satellite,” or supplemental, account for tourism. Estimates by the BEA of the share of national GDP taken up by tourism fall usually around 3%.
For those tracking tourism’s economic dimensions, one has to make judgments about shares of certain sectors to include. How much of restaurant sales, for example, are to locals and to those outside the county? Dean Runyan Associates, or DRA, a national service provider to the tourist industry, publishes an estimate of annual spending, at the state and county level.
The data shows the steep growth over the most recent five-year period, 2014-18. DRA reported a gain from $539 million to $672 million, or a cumulative 25% increase. Interestingly, both the state and the Tri-Cities grew these dollars at the same rate. These last five years represent an increase greater than doubling over the prior five-year interval, when cumulative growth amounted to 11%.
Yet DRA’s reports come with a significant delay. In this era of Covid-19, most of us want to know what the situation looks like now. And governmental data typically doesn’t offer anything close to “real-time” looks at a local economy — with one exception — unemployment claims. Nationally and statewide, these are issued weekly.
In Washington, the Employment Security Department publishes two series on unemployment claims: initial and continuing. This column will look at continuing because it provides a real-time snapshot. In contrast to initial claims, continuing claims counts everyone on the rolls the week before, those added and those who departed.

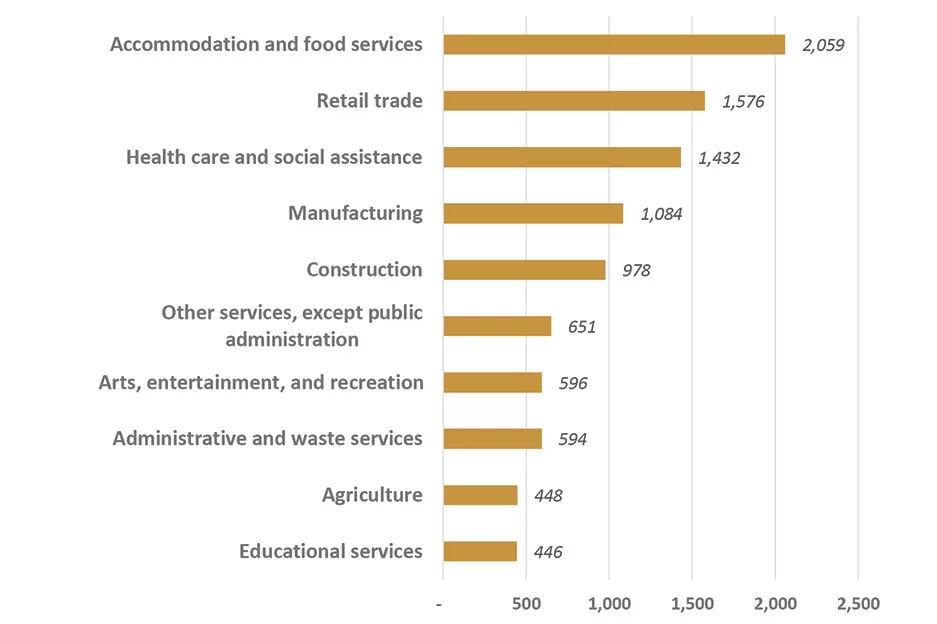
The accompanying chart shows the 10 sectors in the greater Tri-Cities area with the highest number of claims as of June 27.
How has tourism fared in the Covid-19 pandemic? If we use the surrogate of accommodation and food services, despite its shortcomings noted earlier, not too well. It ranks as the hardest-hit among all sectors. As of June 27, the Tri-Cities count of continuing claims totaled over 11,400, implying that the hospitality sector made up 18% of the unemployed.
On a relative basis, the economic pain felt by this sector is now even larger than the peak of the continued claims, which occurred in mid-May in the two counties. Then, unemployed in the hospitality sector made up about 13% of the total. Other sectors have simply come back to life a bit faster.
Now that the two counties have moved up a notch in the phased opening process, it is a likely that especially the food services sector will experience a pickup in employment. But a cautionary note: in many locales across the country, including Spokane, where restaurants re-opened, they are again shutting as the coronavirus roars back.
D. Patrick Jones is the executive director for Eastern Washington University’s Institute for Public Policy & Economic Analysis. Benton-Franklin Trends, the institute’s project, uses local, state and federal data to measure the local economic, educational and civic life of Benton and Franklin counties.
Local News Hospitality & Meetings
KEYWORDS july 2020


