Home » Retail sales face decline but likely less than elsewhere
Retail sales face decline but likely less than elsewhere

November 12, 2020
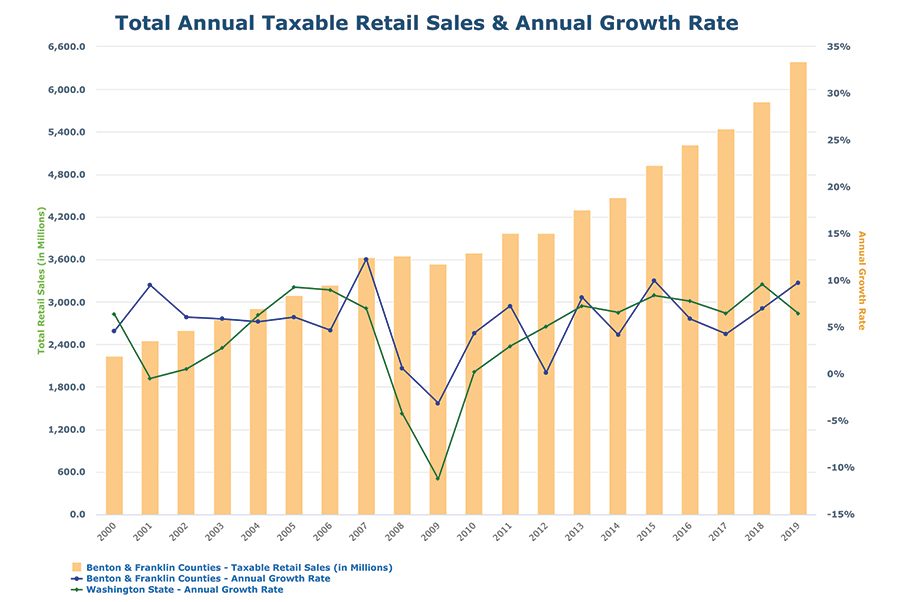
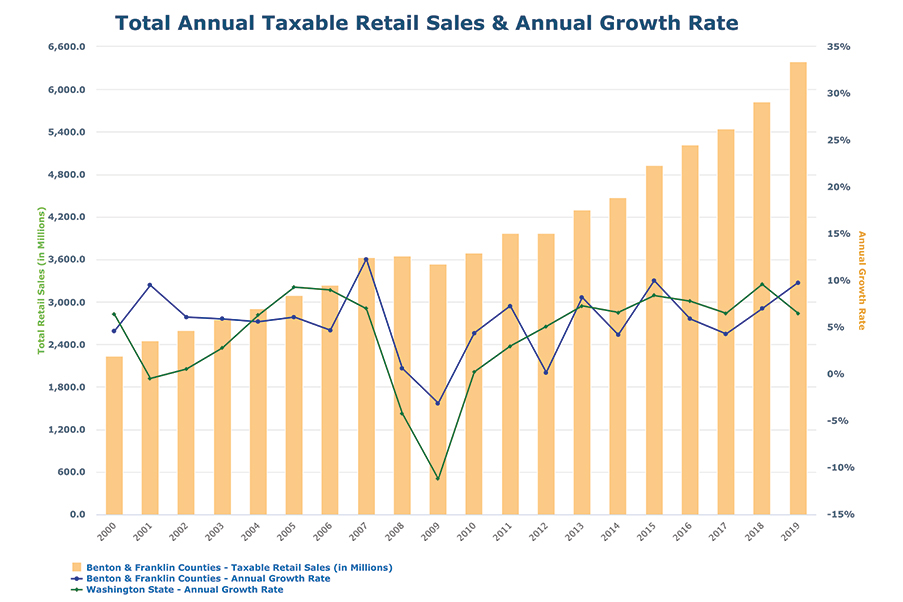
Last year was a very good year for retail sales in the greater Tri-Cities. For the first time, taxable retail sales in the two counties breached the $6 billion mark, ending 2019 at nearly $6.4 billion, as the Benton-Franklin Trends graph shows.
Taxable sales grew year over year by 9.8%. This is the second-best performance of the past decade, trailing only slightly behind the 10% growth experienced in 2015. Taxable retail sales in 2019 nearly doubled the 2005 level. And for the first time in several years, the pace of growth here exceeded that of Washington state.
Over the past decade, taxable retail sales have climbed a cumulative 73% in the two counties. This result places the greater Tri-Cities second among all Eastern Washington metro areas, behind Grant County.
Taxable retail sales in our state doesn’t cover all consumer transactions, or consumption, however. Notably absent are sales of food, medicine and many services. On the other hand, taxable retail sales are not restricted to retail; they cover some manufacturing and construction, hardly items we associate with consumption.
To better understand where growth has taken place, let’s look at the components of this measure, using 2019 breakdowns.

A first takeaway might surprise: “retail trade” transactions made up slightly less than half (49%) of the total in the accompanying graph.
The second largest component was construction, accounting for 18% of total retail taxable transactions.
The third largest segment was the hospitality industry, dominated by restaurants, at 10%.
The three sectors accounted for nearly 80% of all taxable retail sales.
Within the “retail trade” category, the largest single sub-category has typically been the auto sector. Automobiles, new and used, as well as auto parts and the RV trade, made up 21% of the category in 2019. That was closely followed by sales at general merchandise stores (department and big box stores), at 18%. In a distant third place was the wholesale trade sector, at 6%.
What has been behind the dramatic growth in taxable retail sales? If we just look at sales in Benton County, which have amounted to about 75% of the total over the past decade, we see that since 2015, taxable retail sales climbed by nearly $1 billion. It is no surprise that the three largest contributing sectors make up the lion’s share (80%) of that $1 billion gain.
Of particular interest is the disproportionately large share of the gain claimed by construction. While contributing 16% to total retail sales tax collections in 2015, it was responsible for nearly 26% of the gains from that year to 2019. It is no surprise then that the share of the tax total accounted for by construction ticked up to 18%.
How is 2020 shaping up? As is typical for so many economic indicators, we do not have current information. The year started out well, however, as the graph reveals. For the first quarter, taxable retail sales rose by 13.9%.
Data for the second quarter will not be released until later this year. It will undoubtedly show a steep year-over-year plunge, if the Tri-Cities’ experience mirrors that of the state and nation.
Economists at Washington’s Economic and Revenue Forecast Council, or ERFC, assumed a near 35% decline in second quarter national consumption.
While our state economy has fared a bit better than the national one in the pandemic, it has still endured unprecedented declines in economic activity.
The Tri-City economy, while sheltered from this gale force storm by federal expenditures, has been hit by the same forces. Taxable retail sales will certainly show double-digit percentage losses in the second quarter.
What about the second half of this year? Likely much better, if national trends hold.
Automobile sales have been strong across the country, and construction has been far more robust than forecasters predicted at the start of the pandemic.
These sources of strength should show up locally in third quarter results. The ERFC has forecast a 23% increase in national consumption; this columnist’s hunch is that the rate of the state and the two counties will be higher yet.
The fourth quarter may well be different, however. This is typically the quarter in which soft good retailers, jewelry stores and restaurants depend on to make their annual numbers.
In a Phase 2 economy and one accompanied by winter, it seems highly unlikely that shoppers will be thronging to malls and dining establishments. The ERFC, for example, is forecasting an approximate 7% rise in consumption nationally.
So, 2020 will be a roller coaster year for taxable retail sales, starting strong, plummeting in the spring and early summer, while ending modestly positively. Yet, the result is bound to be negative for the year. 2021 should be considerably better, assuming a Covid-19 vaccine is deployed as currently planned and that people get vaccinated.
D. Patrick Jones is the executive director for Eastern Washington University’s Institute for Public Policy & Economic Analysis. Benton-Franklin Trends, the institute’s project, uses local, state and federal data to measure the local economic, educational and civic life of Benton and Franklin counties.
Retail
KEYWORDS november 2020


