Home » Area incomes rose dramatically, but for some more than others
Area incomes rose dramatically, but for some more than others

October 12, 2022
The pandemic threw the greater Tri-Cities a series of curve balls. Consider known deaths in 2020 due to Covid-19: 217 residents. As Benton-Franklin Trends data shows, this amounted to 9.4% of all deaths in the two counties that year. The rate, unfortunately, was nearly twice as high as that of Washington state.
Another hard pitch was the disproportionate impact on Hispanic/Latino employment during the pandemic, a point covered in a prior column. Yet another was the stark decline in performance by area public school students on the Smarter Balanced Assessments, the focus of September’s column.
But the greater Tri-Cities managed to achieve a major hit on a key economic measure: median household income.
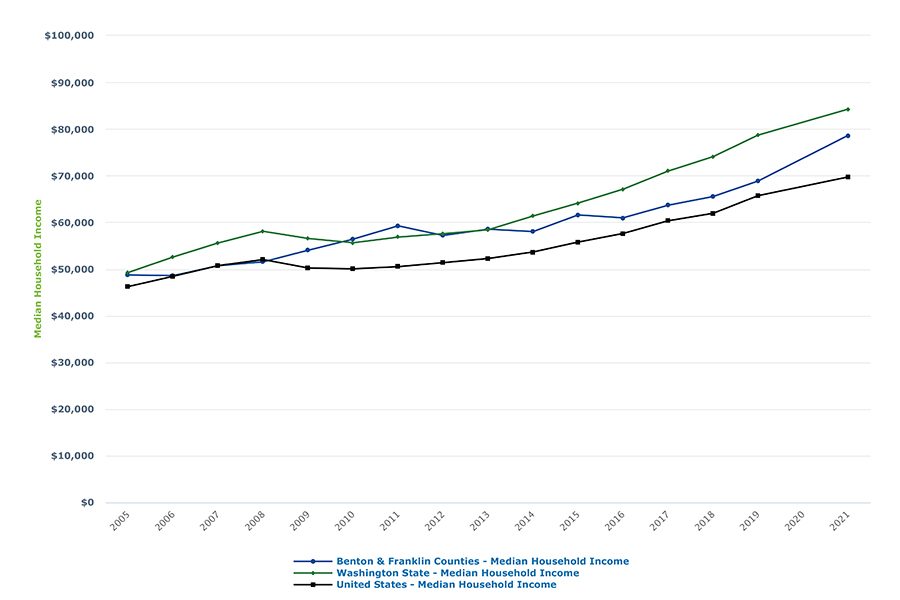
In estimates just released by the American Community Survey (ACS) and posted on the Trends website, annual median household income (MHI) rose to $78,619 in 2021. This represents a leap of nearly $10,000 from 2019. (Census did not publish estimates for the ACS in 2020, due to poor response rates.) This represented a 14% increase over 2019.
As the graph shows, this very large jump accelerated the departure of area MHI from that of the U.S. Nationally, annual median household income in 2021 was estimated at nearly $70,000, or a 6% increase over 2019. While the local MHI estimate still lies below that of Washington, at a little over $84,000, its 14% increase over 2019 doubled the growth rate in the nation’s MHI.
Most economists prefer median household income to per capita personal income as the better estimate of the “middle.” The latter is an average, and income distribution in the U.S. is not symmetric, that is, skewed toward the upper end. So median and average will not match, with the average much higher.
Furthermore, the unit of measure, household, is a fairer representation of how most people live. It accounts for all those who live under one roof. A household may consist of a single person, but includes nuclear families, extended families and non-related people living at the same address. In most cases, individual incomes will contribute to a common household income.
The downside to MHI rests on its origins as an estimate. Per capita personal income is derived from federal administrative records and consequently doesn’t have margins of error, as all estimates do. But with large enough samples, the margin of error of median household income for the population of the greater Tri-Cities is relatively small.
Summary measures, whether median or average, conceal the results of sub-populations.
Group differences may be geographic, such as neighborhoods or zip codes. They may be gender-based. Or, they may be based on race and ethnicity. The ACS estimates offer all these breakdowns. For this column, let’s consider the last criterion.
In a word, income is hardly distributed evenly by race and ethnicity. This statement probably surprises no one. But the local differences may surprise.

Consider the largest component of people of color in the two counties: Latino/Hispanics. Its estimated 2021 median household income of $60,000 represented 78% of the overall MHI.
While that percentage may be disappointing to many, it is worth noting that local MHI of Latino/Hispanics was estimated to be slightly higher than its U.S. counterpart. And over the past five years (since 2016), this large population in the two counties achieved an income gain of 39%, significantly greater than the overall rate of MHI of 29% here.
Incomes for the second-largest racial or ethnic group, Asian-Americans, lie, by contrast, considerably above the overall median.
Census estimated the 2021 value at about $94,500, a premium of 20% to overall MHI in the two counties. The gains of this group since 2016 have been the highest of all in the two counties, including non-Hispanic whites. Their MHI climbed 44%. Despite this large jump, household income here for Asian-Americans still lies below about $6,000 below the U.S. median for this group.
While small, at 2.5% of the population in 2021, Blacks occupy an income position nearly the same as Latino/Hispanics. Their estimated MHI was $61,124, or 78% of the overall rate. Unlike Hispanics, however, the gain of this group over the past five years, at 20%, has been less than the overall rate of 29%.
Space doesn’t allow for further exploration into other, smaller groups. Generally, however, other people of color reported incomes less than the overall median. And their growth rates since 2016 lie below the overall rate of 29%.
Celebrate the unprecedented income gain in 2021 in the greater Tri-Cities? Yes. But there is ample room for improvement in the economic lot of people of color. In a perfect world, one in which all groups had equal access to opportunities, especially education, differences in median income values would be minor. But that world hasn’t arrived yet.
Patrick Jones is the executive director for Eastern Washington University’s Institute for Public Policy & Economic Analysis. Benton-Franklin Trends, the institute’s project, uses local, state and federal data to measure the local economic, educational and civic life of Benton and Franklin counties.
Local News Opinion
KEYWORDS october 2022


