Home » Tri-Cities’ financial sector boosted by strong economy
Tri-Cities’ financial sector boosted by strong economy

July 17, 2018
By D. Patrick Jones
Remember the phrase, “It’s the economy, stupid?” It certainly is true when assessing the state of regional lending. Let’s walk through what the economy does for the regional financial sector. But first, a word about the sector.
The “credit intermediation” industry – largely banks and credit unions – works on a relatively simple proposition: take deposits from customers/members/investors, then loan out the money to customers/members. One stays in business by maintaining a spread between the rate at which the money is loaned and the rate paid to depositors. Obviously, one also stays in business by making sound underwriting decisions.
To grow the business, institutions can lend out a higher multiple of deposits, subject to governmental rules. But this strategy ultimately confronts government limits to protect the safety of the credit system. To expand operations long term, one needs a larger deposit base. Where do greater deposits come from? Outside of a capital infusion by investors, it comes from people willing to keep money in checking, savings and CD accounts. In other words, savings.
Growth of personal savings depends in turn on rising local incomes, and of course, a willingness to save. In addition, regional financial institutions need to offer competitive rates, since they face competition from entities, such as mutual and exchange traded funds. (Socking the money away under a mattress is an option, but probably one not taken too often.)
Consequently, tracking the health of the local economy gives key insights into the likely health of the regional credit industry. If the economy is doing well, personal saving should be expanding and so should deposits. There are a few ways to measure the local economy and this column will touch on two of them.

One of the most straightforward measures looks at per capita personal income. This is simply all personal income in the metro area (two counties), divided by every man, woman and child. As the indicator shows, the metro area has experienced a noticeable increase over time. (So have the U.S. and Washington state as a whole.) As of 2016, the last year for which data is available, this measure stood at a little greater than $42,000. By comparison, in 2008, the dollars flowing to the average Tri-Citian amounted to $35,267. That’s a jump of nearly $7,000. Or in compounded terms, that’s in an increase of 2.3 percent per year.
Those results apply to just one, or the average, person. To arrive at the economy’s total, consider how much the population has grown. That answer can be found in the first indicator on the Benton-Franklin Trends indicator at bentonfranklintrends.ewu.edu. Over the same period, population in the two counties grew by nearly 50,000 souls. Multiplying that count by the increase in per capita income, we arrive at an additional $350 million circulating, at least initially, in the regional economy. The sum income and population growth rates yield a compounded annual growth rate of 4.4 percent. What business wouldn’t like to see its potential market grow every year by more than 4 percent?
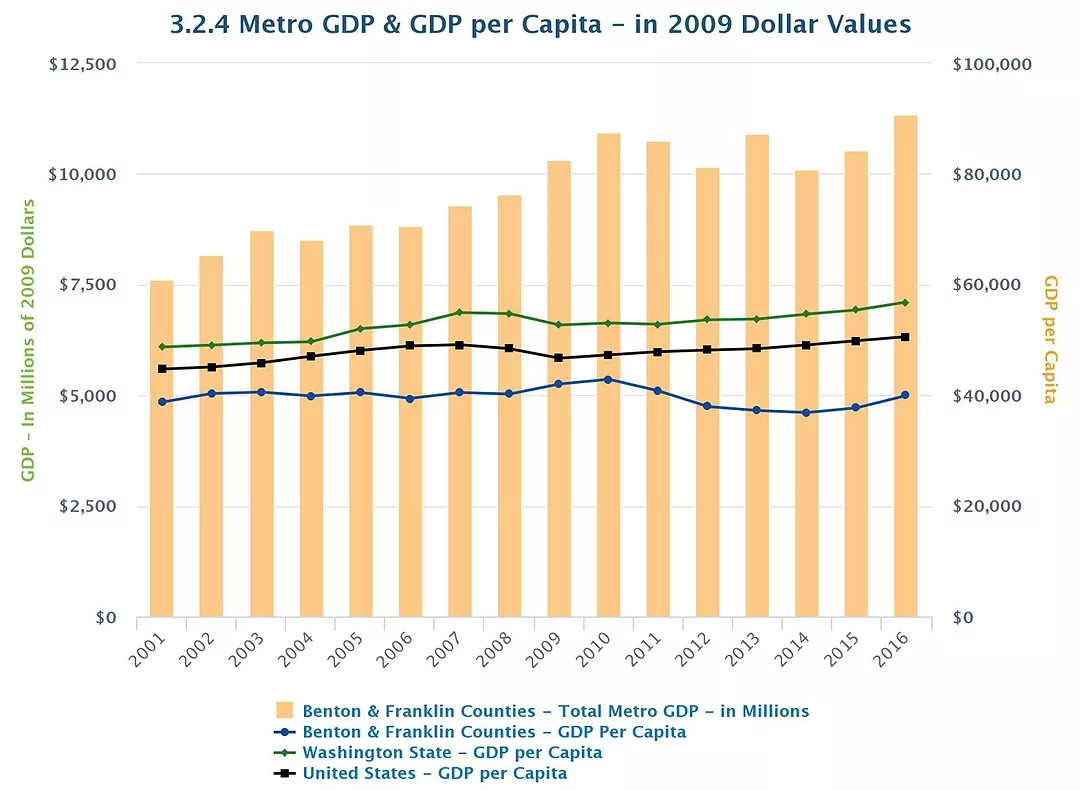
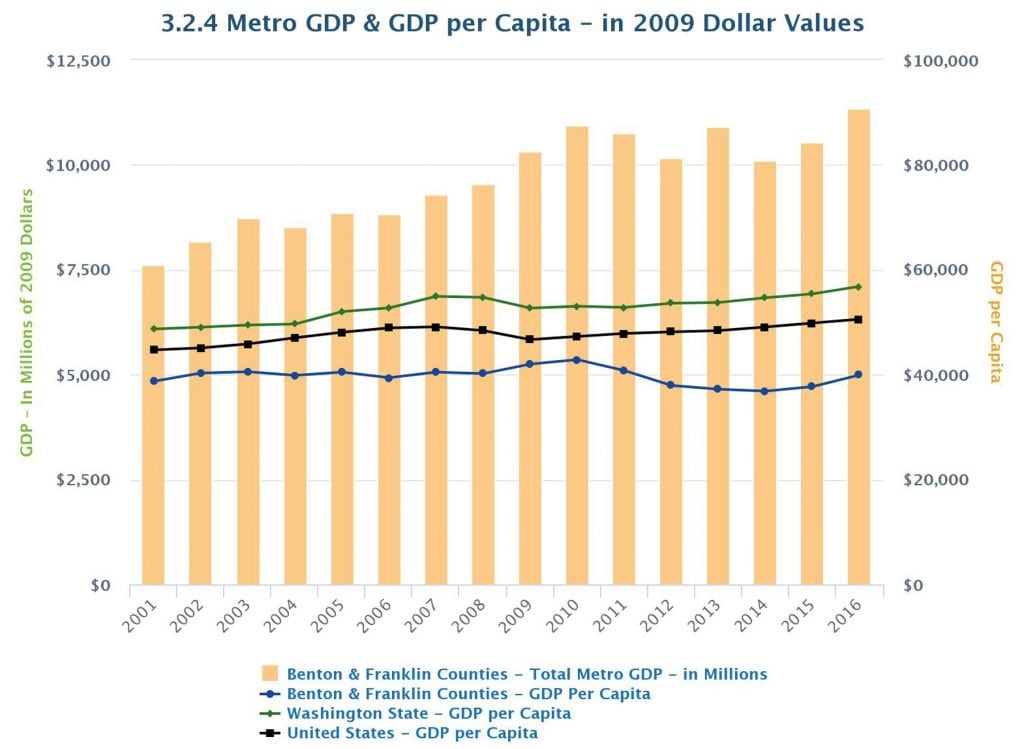
Gross domestic, metro product, or GMP, offers another way to measure the economy and consequently prospects for banks and credit unions. Like its big brother measure, Gross Domestic Product, or GDP, for the U.S., it is the sum of the dollar value of all transactions over a period of time. (It actually counts a concept known as value added instead of final sales, but let’s leave it at that.) And as with national GDP, the values are always offered after inflation has been deducted.
GMP provides a different perspective of growth than per capita personal income does. For example, if inflation were running high, it could be possible that all the increase in personal income is due to higher wages that are merely covering higher prices of goods and services. If that’s the case, then the economy really hasn’t grown, and it’s unrealistic for banks and credit unions to experience increased deposits. So what has taken place here?
Gross domestic metro product, net of inflation, has gone up over the same period in the two counties, but not by nearly as much as the personal income measure. In 2008, it stood at $9.54 billion; in 2016, it registered $11.34 billion. This implies the regional economy grew, in inflation-adjusted terms, at 2.2 percent, compounded annually. This is essentially half of the rate of total personal income.
What measure matters more to regional banks and credit unions? It’s difficult to say but economists like to think that inflation-adjusted dollars more faithfully reflect what is happening in any economy. Even at 2.2 percent growth, the regional economy has enjoyed tailwinds over a difficult period in our country’s economic history. And in 2016, the regional economy enjoyed a terrific bump in this measure. Will the 2017 results extend that experience? The results will be out this fall.
Patrick Jones is the executive director for Eastern Washington University’s Institute for Public Policy & Economic Analysis. Benton-Franklin Trends, the institute’s project, uses local, state and federal data to measure the local economic, educational and civic life of Benton and Franklin counties.
Local News Banking & Investments
KEYWORDS july 2018


