Home » Tri-Cities’ diverse population continues to grow but not its income
Tri-Cities’ diverse population continues to grow but not its income

April 15, 2021
March Madness brings out a latent desire to be No. 1. (Just missed that up here in Spokane.) While many teams have raised their hands with an index finger rising from a fist, not too many municipalities have. Maybe the Tri-Cities should, at least by one measure.
It might not be a widely-followed contest, but over the past decade Benton and Franklin counties have increased their population faster than any other Washington state metro area. Over this period, population here increased a cumulative 17.1%, just nudging out Clark and King counties. With 20% cumulative growth, the population of Franklin County was clearly the single county winner.
Diversity growth
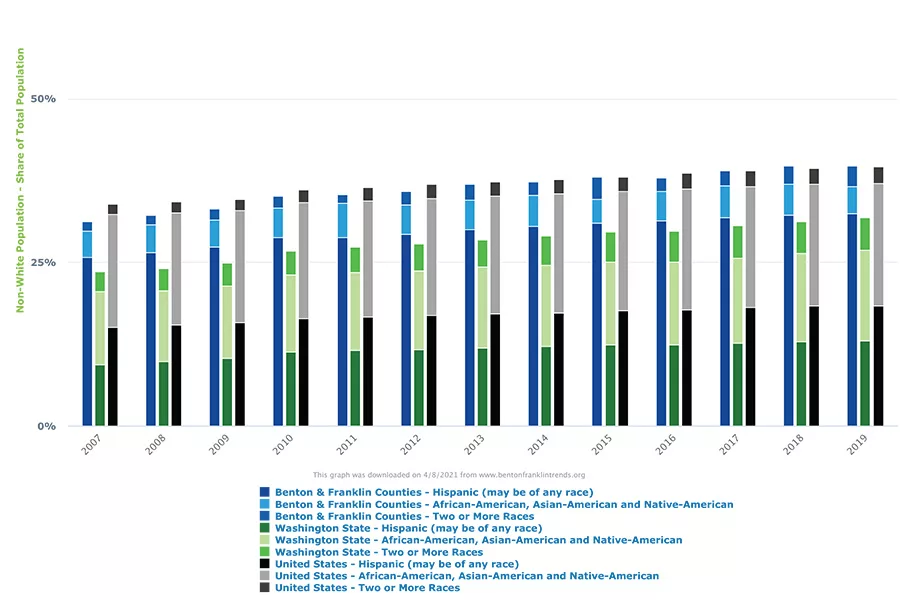
Much of that growth has come courtesy of the greater Tri-Cities’ burgeoning count of people of color. We can make this out via Benton Franklin Trends data, as shown in graph. Looking at the decade of 2010-19, it is easy to notice the climb in overall bar height of the share of racial and ethnic populations here.
Let’s look at the following shares of the total population in 2019: Hispanic/Latinx residents, an estimated 32.4%; two or more races at 3.4%, and all other non-Caucasians at 4.2%. That’s a total of 40%, up from 35% in 2011.
There is no other metro area in the state, outside of Yakima, with such a high percentage of people of color. This share is larger than that of Washington state, which registered an estimated total of nearly 32% in 2019. Note that the relative presence of minorities in the two counties now largely matches that of the U.S, in total.
To no one’s surprise, the non-white mix here is different than in Washington state and the U.S. Specifically, the Hispanic/Latinx population makes up the lion’s share. In 2019, it registered nearly one-third (estimated 32.4%) of the total. This particular composition carries consequences in several areas of life in the greater Tri-Cities.
Disparities remain
Consider income, specifically, median household income (MHI). As Trend data shows, MHI has tracked upward over the dozen years. In nearly all years, its estimated levels have been greater than those of the U.S., although below those of Washington state. The most recent estimate put MHI in the two counties at nearly $68,300. This is far above any other Eastern Washington metro area.
Yet, this middle value hides a huge range out estimates, at least as measured by race and ethnicity. Thanks to the American Community Survey (ACS), one can find values by race and ethnicity for several indicators with a bit of web research. Since the populations involved for the Tri-Cities are largely small, a roll-up of five years is necessary to acquire enough statistical accuracy for the estimates to be meaningful.

Here are the estimates from the most recent five-year period from the ACS for Benton and Franklin counties:
- Overall: $67,310
- Black: $23,815
- American Indian/Alaskan Native: $24,534
- Asian: $88,792
- Two or more races: $71,457
- Hispanic/Latinx: $48,110
Notice the huge variation. Households headed by Blacks and American Indians in the greater Tri-Cities reported incomes over this five-year period at a mere 34% or 36% of overall MHI. On the other hand, those households headed by someone claiming two or more races or an Asian-American reported incomes of 106% and 132%, respectively, of the two-county median.
Take most of these estimates with appropriate statistical caution, however.
Outside of the Hispanic/Latinx populations, people of color in the two counties are relatively few.
Still, even assuming large margins of error, large disparities will remain. Hispanic/Latinx population’s MHI is about 72% of the overall median. Given the size of that population here, that’s an estimate with only a small +/- around it.
These stark income differences hold real effects. One is the varying ability of these different groups to participate as consumers in the local economy. Another is the differential claims that these groups pose to local governments and service providers. More critically, if the trends of those groups with such low incomes persist, the area is in danger of fostering a permanent underclass.
The graduation effect
Education has long been seen, at least theoretically, as a means by which children can break away from trying circumstances of their parents. Are then local results any different for a key outcome, say, graduation from high school?
Trends data shows gradual progress over the decade overall. For the class of 2020, the on-time (four-year) high school graduation rate was 79.5% for the Kennewick School District, 80.5% for the Pasco School District and 92.1% for the Richland School District.
Thankfully, variation by race and ethnicity from these overall averages was not nearly as stark as it is for household income.
In the Kennewick School District, the only outlier came from Blacks, who were considerably below the overall average.
In the Pasco School District, the only real (upward) departure from the overall average was shown by Asian Americans.
And in the Richland School District, there was nearly no significant variation by race and ethnicity.
In contrast to income, these educational outcomes are heartening. Perhaps in a generation income gaps will close. Let’s hope it comes sooner.
When the outcomes are bunched around the average, lots of people can rightfully claim to be No. 1.
D. Patrick Jones is the executive director for Eastern Washington University’s Institute for Public Policy & Economic Analysis. Benton-Franklin Trends, the institute’s project, uses local, state and federal data to measure the local economic, educational and civic life of Benton and Franklin counties.
Diversity
KEYWORDS april 2021


