Home » Commuting in the Tri-Cities: It’s about the car
Commuting in the Tri-Cities: It’s about the car

May 12, 2021
Let’s face it – the Tri-Cities is a car town, or set of car towns.
The number of miles Tri-Citians travel daily owes its origins to the settlement of not one, but three cities, or four, counting West Richland, in an area that has some distance between the communities. There are other reasons, too, which we’ll touch on.
We get in cars for many reasons, but the most common reason is to go to work.
For several years, the Census has published a tool that tracks flows in and out of a city for work purposes. (Search for “On the Map.”) It probably won’t surprise too many readers to learn that there’s a lot of commuter movement going on here.
For example, the latest data show nearly 25,000 residents leaving Kennewick daily, while nearly 24,500 residents enter the city for work.
In Richland, about 29,600 residents from elsewhere go to work daily in the northernmost of the cities, while about 14,600 Richland residents leave town for work.
Similarly, for Pasco, about 23,000 residents leave daily for jobs elsewhere, while 16,500 from other communities arrive for jobs.
In all three cities, the smallest home-to-work flow consists of residents staying within their city for their work. That’s a lot of going and coming! Suffice to say, the Tri-Cities is not (yet) a metro area where live, work and play happen within a small geographical area.

Another dimension of this workflow lies in the geographical footprint of the Tri-Cities.
The combined area taken up by Kennewick, Pasco and Richland is 92 square miles.
Contrast that to the recently expanded city of Spokane at 60 square miles.
As Benton Franklin Trends data reveals, the 2019 population densities of the three cities are 3,161, 2,155 and 1,426 people per square mile, respectively. In 2019, the same metric registered 3,168 for the city of Spokane. And Seattle? Close to 9,000.
Uncovering how and why the urban footprints in this region are so large is beyond the scope of this column. Relatively cheap land, a willingness to annex and a desire for spacious yards likely have been some of the factors. In any case, the development pattern here calls out for travel.
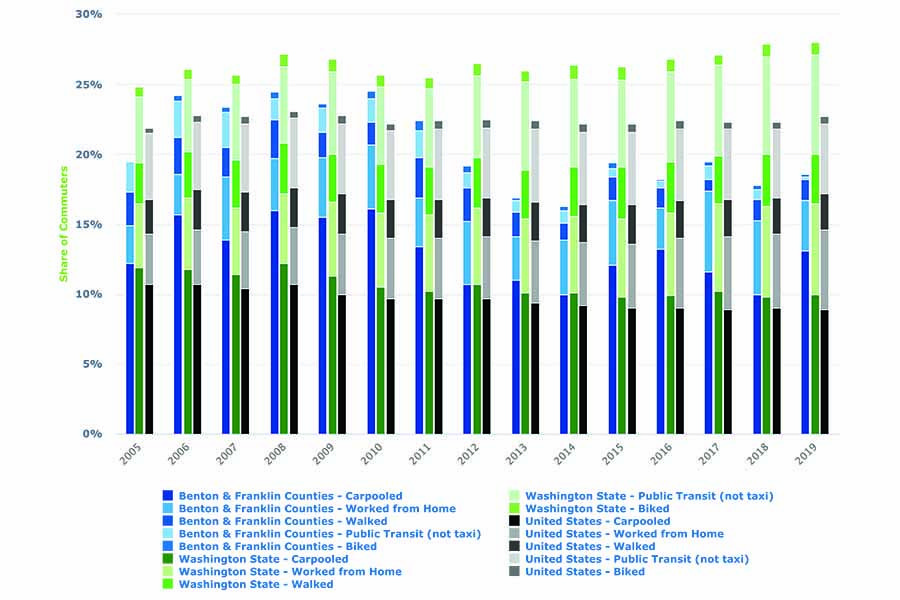
As the graph illustrates, most of that mobility is answered by private auto, at least for commuting purposes. Trends data reveals that “alternative” commuting recently amounted to 18.5% of all work travel in the Tri-Cities. Contrast that to the Washington average share: 28%.
In other words, Tri-Citians depend on the privately-owned vehicle for more than 80% of all commutes.
What has been the favored alternative commute here?
At 13% in 2019, the most recent year of Census estimates, it is carpooling.
The Washington top alternative is also carpooling but at a lower share, 10%. And the second-place alternative in the Tri-Cities? Working from home, at an estimated 3.6% in 2019.
This arrangement grew by a bit over the decade covered by the data, but it still substantially lagged behind the overall Washington rate.
The remaining options amount to a small overall share in the Tri-Cities’ alternative travel-to-work modes. Walking, biking and public transit amounted to less than 2%, a much lower profile than the state average.
This September we’ll receive the Census estimates for 2020. The pandemic has undoubtedly upset mobility patterns here and elsewhere. We know that public transportation systems have been severely challenged by transmission worries of Covid-19. We also know that more people have embraced bicycling than ever before – just ask anyone who has recently tried to buy a bike.
The biggest change, however, has undoubtedly been the switch from a commute by car to one by foot to the home office. How large a shift has this been?
Nationally, this will depend on the mix of jobs. As we know, many jobs cannot be done remotely (aka from home).
For the Tri-Cities, this share is likely higher than the state and national averages. In particular, agriculture and agricultural manufacturing, both essential industries, loom large here. Trends data tracking the five largest sectors by headcount shows production agriculture locally claiming 10% of the workforce, versus 3% statewide. Manufacturing employment here, while not in the top five sectors, is concentrated in agricultural processing.
So it’s this observer’s guess that the work-from-home share of all commuting patterns in 2020 will be a multiple of the 2019 share. It won’t be as large as Washington’s average. But it should be easily three to four times as large.
A big unknown for transportation planners and for those who seek alternatives to the car commute is whether the mobility changes of 2020 will stick – not only into 2021 but into the years beyond. My sense is yes, although not at the same crisis-driven levels of the past few months.
D. Patrick Jones is the executive director for Eastern Washington University’s Institute for Public Policy & Economic Analysis. Benton-Franklin Trends, the institute’s project, uses local, state and federal data to measure the local economic, educational and civic life of Benton and Franklin counties.
Transportation
KEYWORDS may 2020


