Home » STEM jobs have grown, but largely due to health care sector
STEM jobs have grown, but largely due to health care sector

August 12, 2021
Growth has been a common refrain in the Tri-Cities over the past decade.
Population has climbed, as Benton-Franklin Trends laid out, from 262,500 in 2012, to the estimated of 308,800 today. Similarly, the average number employed, has risen from 120,474 in 2011, to 130,516 in 2020. And median household income has enjoyed steady improvement, from $56,407 in 2010, to an estimated $68,283 in 2019.
But one key feature of the greater Tri-Cities has not increased: the relative standing of science and technology jobs.
For sure, the number has grown over the past decade – from a little more than 12,000 in 2012, to an estimated 13,670 in 2021.
Yet, as a share of the work force, these jobs have actually diminished a bit. In 2012, they amounted to 13.8% of the Benton and Franklin county workforce. Now they claim 13.3%.
These measurements rely on the U.S. Department of Labor’s (DOL) Employment & Training Administration classification. It can be found at onetonline.org. Generally, DOL casts its science, technology, engineering and math, or STEM, net broadly across the occupational universe. Its reach includes many health care professions, for example. It even folds in social scientists such as this column’s author.
And what are the most numerous STEM occupations in the greater Tri-Cities?
Let’s start with nursing. The number of registered nurses this year was estimated to be 2,076. Rounding out the top five are occupations that we associate with either Pacific Northwest National Laboratory or the Hanford cleanup: environmental science technicians, at 851; civil engineers, at 627; chemists, at 600; and software developers, at 597.
Following closely behind are environmental engineers at 591, medical dosimetrists at 535, engineering managers at 515, engineers not otherwise categorized at 437, and mechanical engineers at 404.
This is quite a lineup of highly skilled professionals, or as we in economics like to say, human capital. But why, despite much effort, has the pool of STEM jobs not deepened in the greater Tri-Cities?
Comparing individual occupations within the Washington State Employment Security Department (ESD) annual snapshots does not help too much.
In 2021, for example, no nuclear engineers were counted, while in 2012, the two counties reported a total of 461. It could be that there are fewer engineers in 2021, but they are unlikely to be zero. It could well be that some of the 2012 slots have been re-classified, in categories such as chemical engineers.
Conversely, ESD economists counted 627 civil engineers in the two counties in 2021 while the entry for the same in 2012 was zero.
Despite our inability to make comparisons for all STEM occupations, the total count is still useful for pointing out a broad trend: the science and technology “economy” in the greater Tri-Cities hasn’t grown too fast over the past decade.
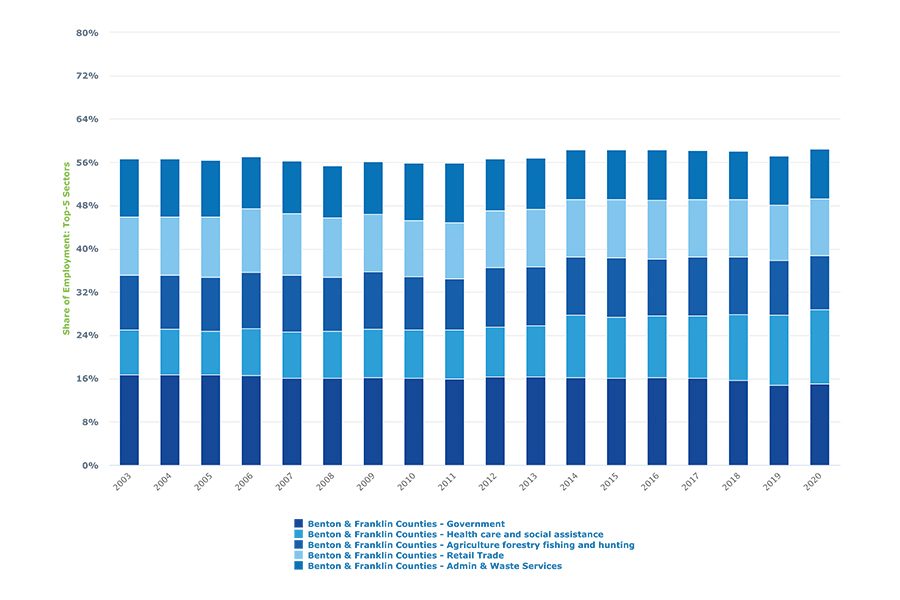
Validation of that claim can be found in another description of the local economy: headcount by industry. Trends data in the accompanying graphic depicts the five largest sectors.
Outside of the medical sector, STEM employment is anchored in two industry sectors.

Administrative & Waste Services is the highest segment. The sector is largely composed of the latter component in the bicounty area.
Employment in this sector amounted to 9.2% of the total in 2020, dropping from 11.1% a decade prior (2011).
The head count, seen in the measure’s dataset, also shows a decrease – of more than 1,200 jobs. Admittedly, the Hanford cleanup enjoyed a burst of activity following the Great Recession, which exaggerates the losses. Yet, the number of jobs in the past three years has declined.
Another sector capturing a large part of STEM employment, Professional & Technical Services, is not among the top five by headcount.
The data set, however, tracks its status over time. Ten years ago (2011), the count stood at 11,665. In 2020, it had shrunk to 8,676. In fact, during the past three years, employment in this sector has averaged around 8,600.
The final sector that contains a considerable number of STEM jobs is Health care & Social Assistance. The sector’s numbers are driven by the first component.
While all health care occupations have grown, the growth in jobs reflects, to a large degree, the numbers of registered nurses.
Trends data shows the sector’s share stood at 13.8% in 2020. A decade prior that share was 9%.
The sector has added nearly 75,500 jobs over the past decade. Not all, of course, of these positions are considered STEM.
In the face of declining employment in Waste Management and in Professional & Technical Services, health care is the likely source of growth in STEM jobs in the two counties.
The enviable concentration of scientific and technical talent in the labor pool is still here. Any growth in the traditional engineering and science workforce, however, is increasingly overshadowed by the number of health care professionals.
D. Patrick Jones is the executive director for Eastern Washington University’s Institute for Public Policy & Economic Analysis. Benton-Franklin Trends, the institute’s project, uses local, state and federal data to measure the local economic, educational and civic life of Benton and Franklin counties.
Science & Technology
KEYWORDS august 2021


