Home » The economy in 2020 slowed but didn’t stop; 2021 will finish much higher
The economy in 2020 slowed but didn’t stop; 2021 will finish much higher

November 15, 2021
If you are the CFO, treasurer or accountant for any organization, you are excused if you hit the panic button over a year ago. The outbreak of Covid-19 brought unprecedented worry that the machinery of our economy would grind if not to a halt, then stagger forward.
Those worries were understandable for anyone charged with ensuring financial stability of an organization. Fortunately, in most cases they were not realized.
Taxes, especially transactions-based taxes such as retail sales, reflect economic activity. In this state, many sectors other than retail trade are subject to the retail sales tax.
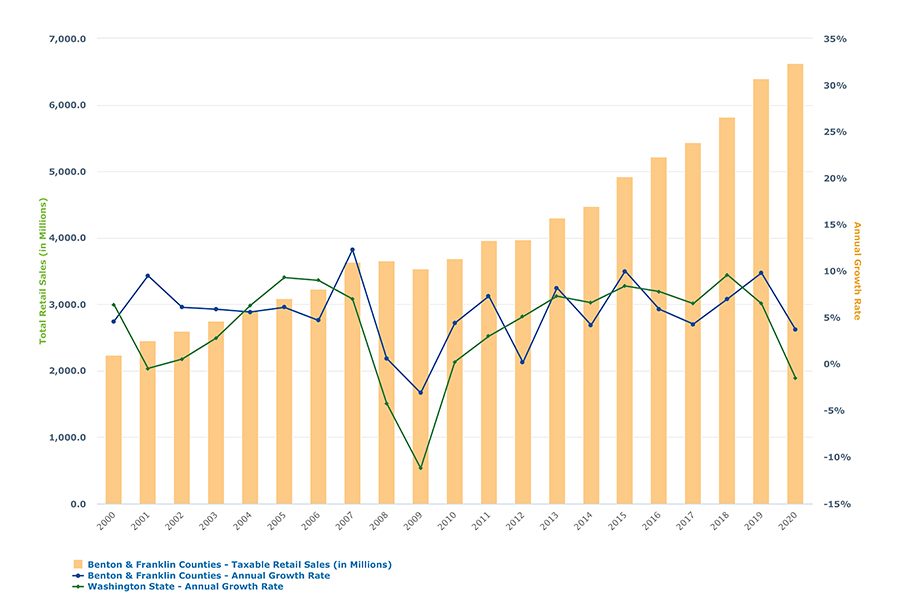
Anyone with some fiscal authority during the Great Recession of 2008-09 probably remembers the impact of the financial sector’s near-meltdown on local economy activity. As Benton-Franklin Trends data reveals, the only time in recent years that the growth rate of taxable retail sales turned negative was 2009, when it slipped 3.1%.
Yet, in 2020 there was no downturn.
Taxable retail sales in Benton and Franklin counties rose 3.7%. Local taxable retail sales fared better than throughout all of Washington, where year-over-year taxable sakes turned negative 1.5%.
There are many reasons why the economic response to a crisis was different this time. An undeniably important one is that the Washington, D.C., acted differently. Congress quickly passed a large stimulus package. And the Federal Reserve Bank sharply increased the money supply, thanks to unprecedented buying of a range of securities.
If in the face of the pandemic taxable retail sales went up, then local tax collections went up, to great relief of municipal governments.
Their budgets depend greatly on sales tax revenues for sustaining services.
According to the consolidated accounts of local government provided by the Washington State Auditor’s office, sales taxes amounted to 43% of all taxes collected in the two counties last year.
This was slightly higher than four years prior, when sales taxes amounted to 42%. (The measure includes both counties and the counties’ five largest cities.)
Beyond taxes, local municipal governments rely on other sources of revenue. Broadly speaking these consist of transfers from other (larger) governmental entities and charges for goods and services. Depending on the jurisdiction, retail sales tax amount to the thickest (largest) or second-thickest leg of the stool of local government revenues.

The second most important tax for local governments, not to mention non-municipal public bodies, is the property tax.
In 2020, for the same group of seven local governments, it amounted to 36% of all taxes collected by the seven municipal governments. That is up slightly from its combined share of 35% in 2017. Significantly, its levels, too, are much higher in 2020 than in 2017: $95.3 million vs. $82.7 million.
Washington state law allows property taxes to increase by only 1% per year on existing property. So much of the increase in property tax totals seen by local governments is due to new construction.
Trends data reveals a dramatic spike in the assessed value of new construction between 2017-20 in the two counties.
Over $245 million in new construction valuation took place in the past four years. Between 2019 and 2020 alone, the new construction valuation jumped by approximately $145 million.
It is easy to imagine that the annual value of new construction will breach the $1 billion mark this year or next.
Why the greater Tri-Cities were able to buck the downturns of the U.S. and Washington would take more than another column.
The relative stability provided by the Hanford cleanup and Pacific Northwest National Laboratory and the large presence of agriculture – an essential service – in the local economy, certainly come to mind.
Taxes raised by the local economy this year should be much stronger than 2020.
Quarterly taxable retail sales for the first quarter of 2021 from the Washington Department of Revenue reveals a dramatic increase for the first three months of the year over the same period in 2020: 16%.
This increase bested a strong recovery for the entire state by 4 percentage points.
Second quarter results likely will show an even greater increase since the pandemic shutdown squeezed businesses most from April through June of last year.
The Department of Revenue issues quarterly updates approximately four months after the end of a quarter.
Statewide results are already available, and on a monthly basis show increases of 14% to 50%.
Statewide collections for July and August also report double-digit percentage gains over 2020, so the third quarter is likely to end strong as well.
Even if the pace of gains lessens in the fourth quarter, a likely outcome given the impact of the delta variant, local governments should anticipate a strong year in sales tax receipts.
2022 likely will continue the gains of this year, albeit at a slower pace.
That’s based on the state outlook by the Economic and Revenue Forecasting Council from its most recent projections. And for the first two quarters of this year, local residential building permits are up by high double digits, a harbinger of robust future construction activity.
Taxes to local governments should follow suit.
D. Patrick Jones is the executive director for Eastern Washington University’s Institute for Public Policy & Economic Analysis. Benton-Franklin Trends, the institute’s project, uses local, state and federal data to measure the local economic, educational and civic life of Benton and Franklin counties.
Retail
KEYWORDS november 2021


