Home » Tri-Cities boasts more engineers than state average
Tri-Cities boasts more engineers than state average

January 12, 2022
It will come as no surprise to readers that Benton and Franklin counties boast a high number of engineers.
According to data from the state Department of Employment Security (ESD), the area’s economy supported nearly 3,000 engineers in spring 2020.
Those are numbers from the latest survey, published in July 2021. But it may come as a surprise that the number in the legal profession here is relatively low. The same applies to architects and total head counts in their firms.
These three occupations make a significant portion of the sector categorized as “Professional, Scientific & Technical Services.” Other firms in the sector include public accounting, advertising, computer facilities management, general consulting, interior design, market research, photography, veterinary medicine, and, significantly for the Tri-Cities, scientific research. All together, these companies employ a large portion of the knowledge workers in a regional economy.
Engineer workforce
As of 2020, engineers made up 2.8% of the local workforce. That slice is much higher than the state average of 1.6%. The share of the local workforce taken up by ancillary engineering occupations, such as technicians, is much smaller, at 0.6%, but still higher than the share these occupations make up at the state level.
The range of engineering specialties runs the gamut here. Well, almost.
Notably missing in the comparison to the state’s engineering fields are the fields of aerospace, computer hardware and biomedical. The five largest engineering specialties in the greater Tri-Cities are, in order: civil, environmental, mechanical, electrical and chemical.
On the other hand, the legal field adds up to a fraction of the engineers, at slightly less than 400. Lawyers number 175, paralegals 197 and judges 25. Together, that’s 0.4% of the local workforce. Statewide, the same three occupations make up 0.7% of the workforce.

Architects make up the smallest slice of the three knowledge worker occupations taken up in this column, numbering 65 in the two counties, or less than 0.1% of the workforce. The state concentration ratio for this profession is about twice as high.
Why should we care? At a fundamental level, because occupations making up this sector garner high salaries. Take engineers. The same survey revealed a range of average annual salary of approximately $95,000 for civil engineers to $124,000 for materials engineers in the greater Tri-Cities. The average annual salary of lawyers in 2020 was estimated to be $105,000. Similarly, the average annual salary for architects here came in at $96,000.
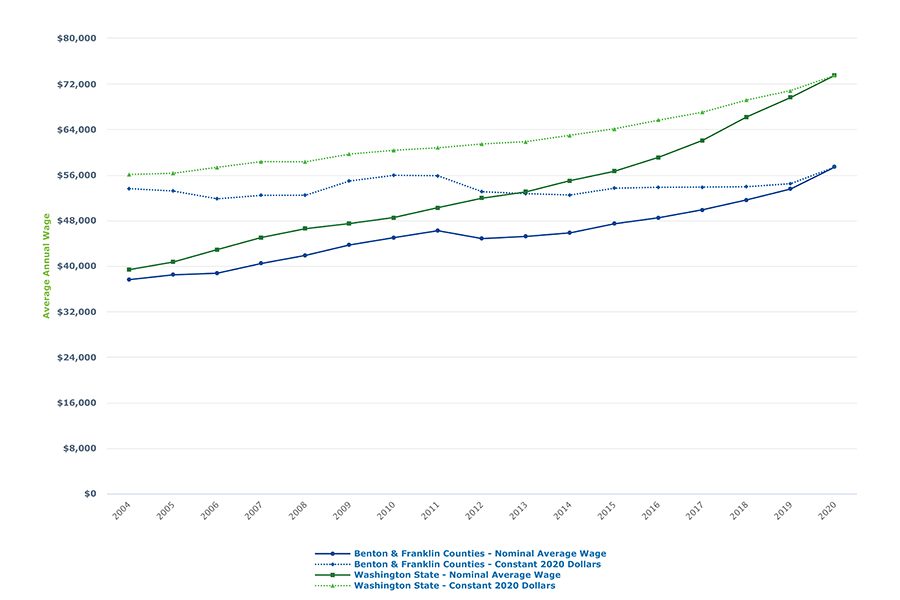
These are far higher levels than the average annual wage for 2020. As Benton-Franklin Trends data shows, the two-county average was slightly greater than $57,000 annually. While this is the top result of all of the metro areas of Eastern Washington, it is still far below the Washington average for the same year, at $73,500 a year. Without the presence of these three well-paying professional groups, the overall Tri-City average would be much lower.
Since wages and salaries compose the largest component of income, and since incomes drive our ability to consume and save, and since these activities help fund the public goods of governments and school districts, it’s obviously welcome to have higher wages.
From a perspective that is harder to quantify but still important, knowledge workers bring talent outside of their jobs to the community.
Their presence shows up in nonprofit organizations, school districts, service clubs and even local government. Architects, engineers and lawyers aren’t the only knowledge workers, of course. Think of the growing health care sector. But given the outsized presence of especially engineers here, their influence is felt in many corners of the community.
Workforce forecast
Where might the future of these occupations be in the greater Tri-Cities?
Barring a collapse of the Hanford project and a move of Pacific Northwest National Laboratory to another location, it looks bright. Expected population growth will push up the need for architectural and the legal professions. Washington State Office of Financial Management (OFM) currently is predicting a gain of 48,000 between now and 2030.
More engineers?
The labor economists at ESD annually create forecasts for the upcoming decade. What does their model hold for engineers? The latest release for Benton and Franklin counties calls for an annual growth rate in the first half of this decade of slightly less than 1% per year, and for the second half of the decade at slightly more than 1%. Those projections are considerably higher than the rate for the overall local economy.
Most regions in Washington state, and especially those in Eastern Washington, would do handstands to celebrate this occupational future. While I haven’t heard of too many local leaders celebrating this way, my hunch is that figuratively they are.
Patrick Jones is the executive director for Eastern Washington University’s Institute for Public Policy & Economic Analysis. Benton-Franklin Trends, the institute’s project, uses local, state and federal data to measure the local economic, educational and civic life of Benton and Franklin counties.
Local News Architecture & Engineering
KEYWORDS january 2022


