Home » Tri-Cities’ greenhouse gas footprint better than most metro areas
Tri-Cities’ greenhouse gas footprint better than most metro areas

May 11, 2022
Over the next few years, we’ll be hearing a lot about Scope 1, 2 and 3.
No, it’s not a revisit of a famous trial in Tennessee about a hundred years ago. The terms invoke science, however. Instead of a reflection on human ancestry, they look ahead to the future of the planet and, in particular, to emissions from economic activities.
The U.S. Security & Exchange Commission (SEC) is using the concept of scopes 1-3 of greenhouse gas (GHG) emissions to draft mandatory disclosure requirements by publicly-held companies. This characterization of GHG emissions is an outgrowth of the Greenhouse Gas Protocol, a group of environmental organizations and businesses.
Essentially, Scope 1 covers the GHG emissions of an enterprise’s operations, Scope 2 emissions of purchased power and electricity, and Scope 3 emissions incurred by suppliers, including transportation services, to an enterprise. As you might imagine, it is somewhat straightforward to calculate Scope 1. It becomes increasingly difficult to tally the GHG footprint of scopes 2 and 3.
This is not a technical column on the intricacies GHG accounting.
And the greater Tri-Cities doesn’t host a headquartered company subject to SEC rules, to the best of my knowledge. Furthermore, environmental accounting is still in its infancy. Yet, the framework will ultimately impact companies here, since branches of national, publicly-held companies are present in the two counties.

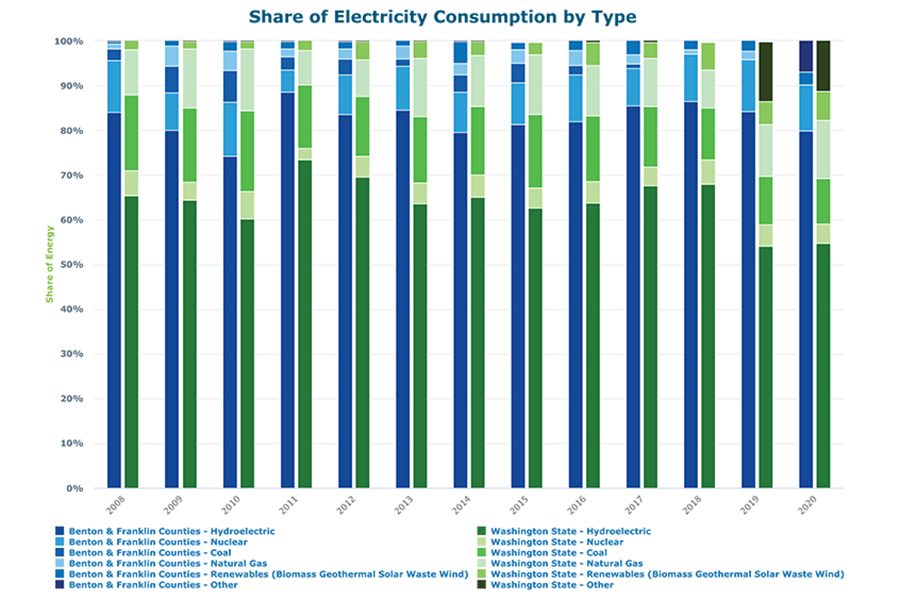
When the counting starts, however, negative environmental balance sheets likely will be uncommon. Businesses in the greater Tri-Cities enjoy and likely will continue to enjoy a major advantage, as Benton-Franklin Trends graph, “Share of Electricity Consumption by Type,” makes clear. The tallest segment of the bar depicts the share of electricity from hydropower. Most recently, this was 80%. Over the past decade, hydro’s share of electricity has averaged a bit more than 80%.
In a state where hydropower has pushed more electrons through our grid than any other source, the results for the two counties are notable. They are much higher than those of Washington, with the most recent year showing a 55% hydro share in the state.
The (small) segment of the 2020 bar that is third from the bottom refers to renewables. In the two counties, wind makes up the bulk of this segment, coming in with a 3% share in 2020. Over the dozen years tracked by the indicator, renewables have increased the fastest, largely due to their very low base in 2008. Still, their share is less than of the current Washington value of 6.4%.
The remainder of the electricity mix in the two counties is unique. First, no coal can be found. It has been absent from the mix since 2017. Even then, its share was less than 1%.
The larger departure from the state profile, however, is due to nuclear. In 2020, the state’s overall share of nuclear-provided electricity was 4.3%. Its counterpart in the greater Tri-Cities? 10.2%. That share has been as high as a little over 11%.
Depending on your classification of nuclear as a green source, electricity consumers here can point to a green total share currently at 93%. That is far greater than the same green electricity sources in the state, which sum to about two-thirds of the area’s. Even without putting nuclear on the green side of the ledger, the Tri-Cities is far ahead of the state in scopes 1 and 2 emissions in electricity consumption.
Of course, electricity consumption isn’t the only source of GHG emissions. We need to consider the footprint of natural gas. Census most recently reported that 19% of area homes are heated with natural gas – from a utility or portable use.
Then there is the transportation component. Recent national estimates by the U.S. Environmental Protection Agency for 2019 assigned a share of 29% to the transportation sector for all GHG emissions in the country. This is the largest share, followed by electricity production at 25%.
Like other metro areas, the transportation profile of the greater Tri-Cities is decidedly not green.
In fact, it may be browner than most on a per capita basis. Why? The urban footprint here is large. Equivalently, population density is low. Benton-Franklin Trends shows 3,064 people per square mile in 2021. Kennewick is the most densely populated of the Tri-Cities. Richland’s density is by far the lowest, at 1,518, while Pasco’s density lies neatly between the two. These are among the lowest in Eastern Washington metros.
Getting to and from work then involves significant travel, mostly privately owned vehicles, as Trends data reveals. If EVs, however, make a significant penetration in the next decade here, the greening of the Tri-Cities will jump. Tri-City drivers will have the right kind of juice for those battery packs.
Patrick Jones is the executive director for Eastern Washington University’s Institute for Public Policy
& Economic Analysis.
Local News Energy Environment
KEYWORDS may 2022


