Home » Let’s look at Tri-City economy through the lens of Charles Dickens
Let’s look at Tri-City economy through the lens of Charles Dickens

December 14, 2022
One of my fondest childhood memories of this time of year was listening to the deep baritone of English actor Basil Rathbone as he narrated Charles Dickens’ “A Christmas Carol” on my parents’ record player. (Yes, I know that dates me.)
It made a toys-under-the-tree obsessed kid actually think about people I hadn’t seen. Kids who didn’t have toys under the tree.
As we celebrate the holidays this year, I’d like to bring a Dickensian perspective to the economy of the greater Tri-Cities. In particular, let’s look at those members of this community, now over 300,000 souls, whose lives look more like Tiny Tim than comfortable, middle-class Americans.
Over the columns of the past year, we’ve celebrated some good economic news, including the recent rise in median household and per capita incomes, seen in Benton-Franklin Trends data.
Increases in these key measures have outpaced the nation. The measures are covered by the Trends because, as middle values, they summarize lots of information in one number. But like all middle values, they don’t tell the entire story or address all our questions.
21st century America is acutely interested in the distribution of income and wealth.
Trends data includes a classic measure of income distribution, by quintiles.
There’s more information to be gleaned from this indicator that can be covered in the confines of this column. But let’s summarize the results by comparing the ratio of total income claimed by the upper 20% of households to the income claimed by the bottom 20% of households.
For 2021, the ratio was 11.9. This implies that the average household in the top 20% claimed nearly 12 times as much income as the average household in the bottom 20%.
It seems like a huge disparity. And it is compared to Canada, Germany or Japan, via a slightly different calculation from the economists at the Organization for Economic Cooperation and Development.
Set against the U.S. and even Washington, however, the two counties fare relatively well. In the U.S., the same ratio in 2021 was 17.3; for the state, 15.8. The gap between rich and poor here is large, but not as large as elsewhere in the U.S.
Significantly, the top-to-bottom quintile ratio has shrunk over the past 15 years in the greater Tri-Cities. In 2006, it stood at 12.7 and a decade ago 13.6.
When asked to describe the status of those placing low on economic scales, most people will point to the poverty rate. Specifically, to the number and share of the population living at or below the Federal Poverty Level (FPL).
Understandably, Benton-Franklin Trends covers that data.
The measure goes back many decades to President Lyndon Johnson’s Great Society reforms and has been the subject of countless studies and much discussion about how to improve it.
The U.S. Census Bureau produces an alternative, the Supplemental Poverty Measure, that takes account of noncash benefits as well as expenses.
Generally, the resulting rate is higher by 1-2 percentage points than the standard one. (The federal stimulus packages passed to counter pandemic financial hardship resulted in a supplemental rate that was lower than the official one for once.)
The FPL is updated annually by the census bureau.
For a family of four in 2022, the FPL was $27,750. For an individual, it was $13,590. These thresholds imply that a family with incomes of $28,000 or individuals with incomes of $14,000 are considered not to be officially in poverty.
What, then, does the Trends tell us about individuals in the greater Tri-Cities with incomes below the FPL?
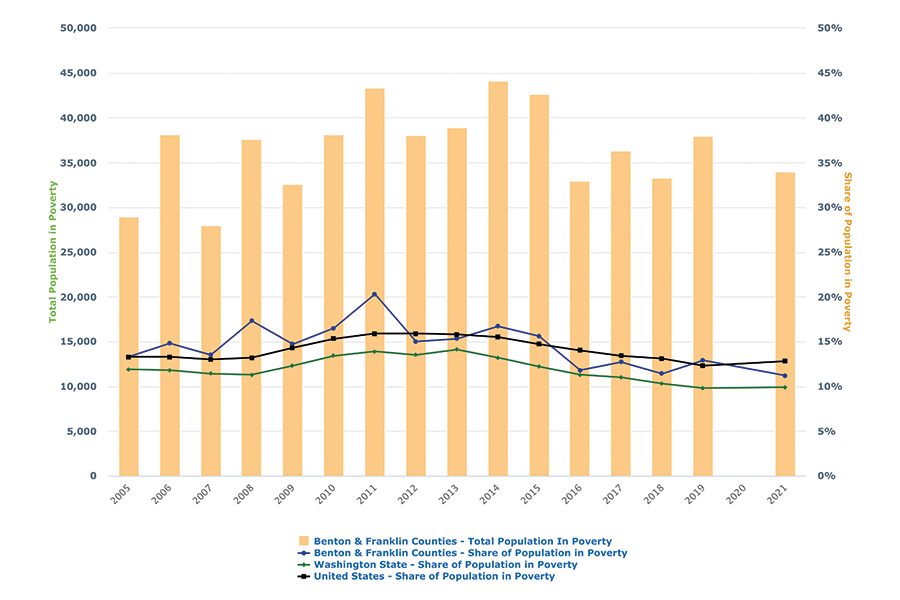
From the perspective of time, some progress. The census estimated the number of in 2021 to be about 34,000. That is down considerably from the 2014 peak of slightly over 44,000. Similarly, the 2021 rate, at 11.2%, was the lowest observed in the past 15 years in the two counties.
The peak of 20% took place in 2011.
Over time, the rate here has fallen faster than the decline in the rate in the U.S. However, the rate for Washington has remained lower over all years.

Not surprisingly, the share of the total population living at or below the FPL obscures some insightful demographic differences.
One is age, in particular, youth. Census data shows it’s easy to observe that the estimated poverty rate for youth (under 18 years) in 2021 was about 15%, and for those under 5, nearly 20%.
Another variation from the overall share can be found by race and ethnicity.
The 2021 rate for the Hispanic population was estimated at 19%, not quite double the overall rate. The rate for non-Hispanic whites: 6.7%, or nearly a third of the Hispanic rate. Due to small sample size, the Census does not provide single year estimates for other races.
But a glance at the five-year average 2016-20 shows that the rates for Blacks and Native American/Alaska Natives were slightly higher than the Hispanic rate. On the other hand, the Asian rate was lower than the non-Hispanic white rate.
It’s clear that we know where the Tiny Tims of the greater Tri-Cities can be found. May they share in economic progress this coming year as much as their neighbors.
Patrick Jones is the executive director for Eastern Washington University’s Institute for Public Policy & Economic Analysis. Benton-Franklin Trends, the institute’s project, uses local, state and federal data to measure the local economic, educational and civic life of Benton and Franklin counties.
Year in Review Opinion
KEYWORDS december 2022


